
Statistical Map of Living Area
Service Overview
O 'Statistical Map of Living Area' is a visualized service showing the living area that can be reached within a specific time from a specific facility (place) by a user, and provides statistical data of the living area.
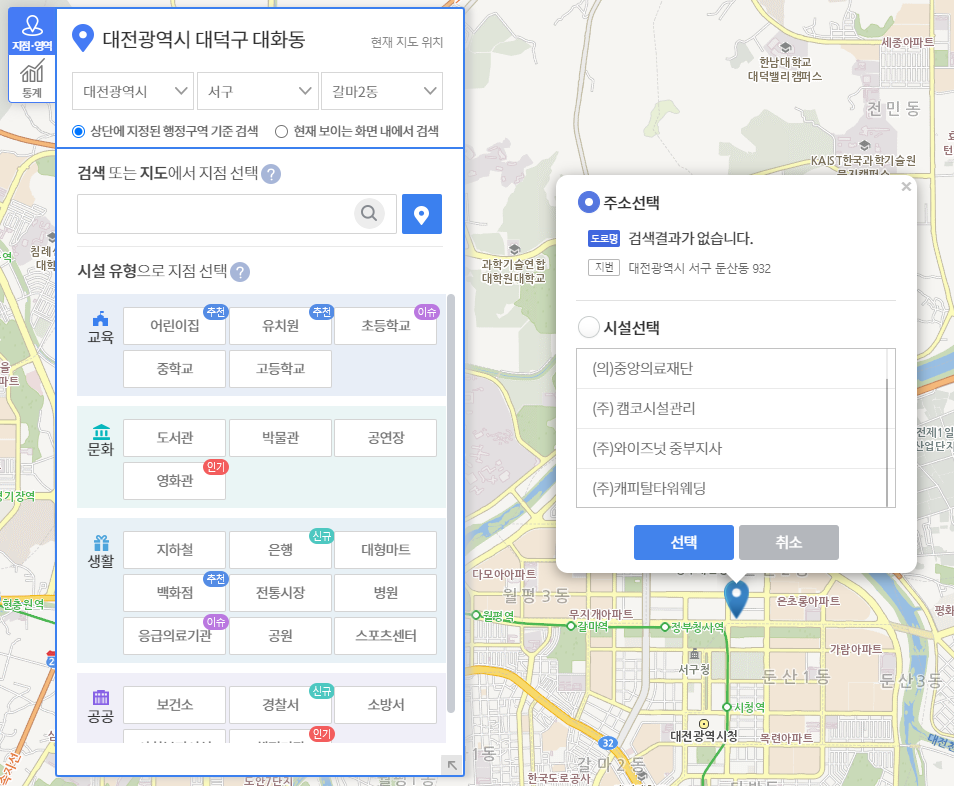
O Users can search for the location of a specific facility (place), select a place on the map or select a place from pre-categorized facility types.
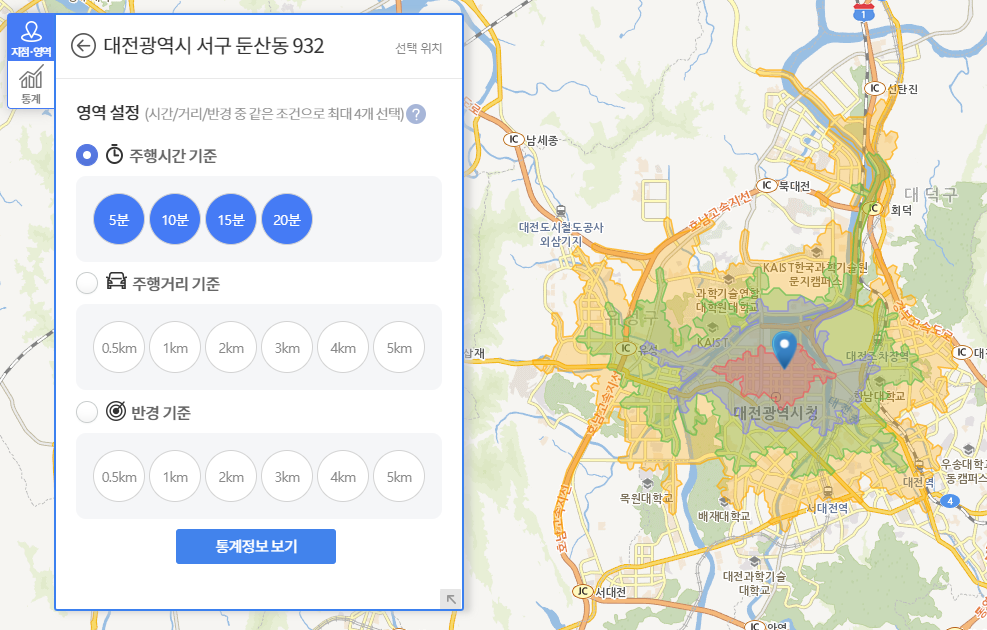
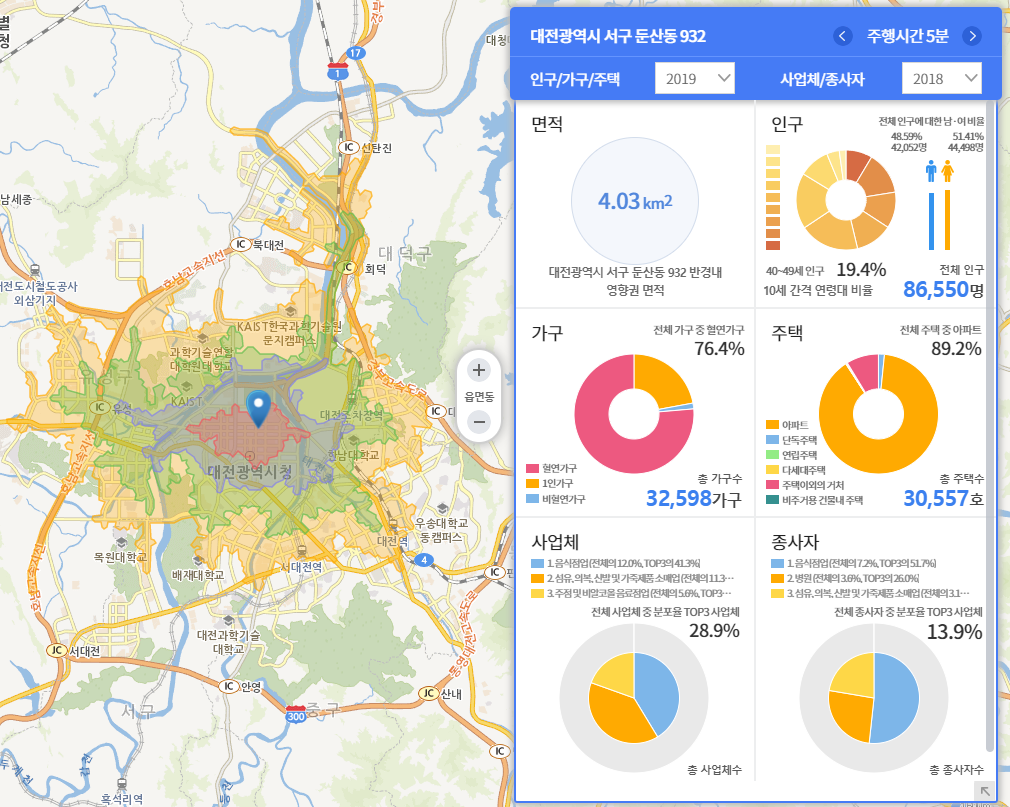
O After setting an area based on the driving time, mileage and radius by using the road network data containing road information and characteristics, users can check the entire information about the area or search data distribution within the area in the grid* unit.
* Grid: An area divided by horizontal and vertical lines that intersect at right angles regardless of administrative districts
O Major functions
| ① Place selection |
| Select a place from pre-categorized facility types, search for a place by place name or on the map |
 |
→
| ② Area creation |
| Create an area based on driving time, mileage, radius, etc. |
 |
→
| ③ Statistical data retrieval |
| Retrieve statistical data and grid unit distribution in the area |
 |
Screen Layout
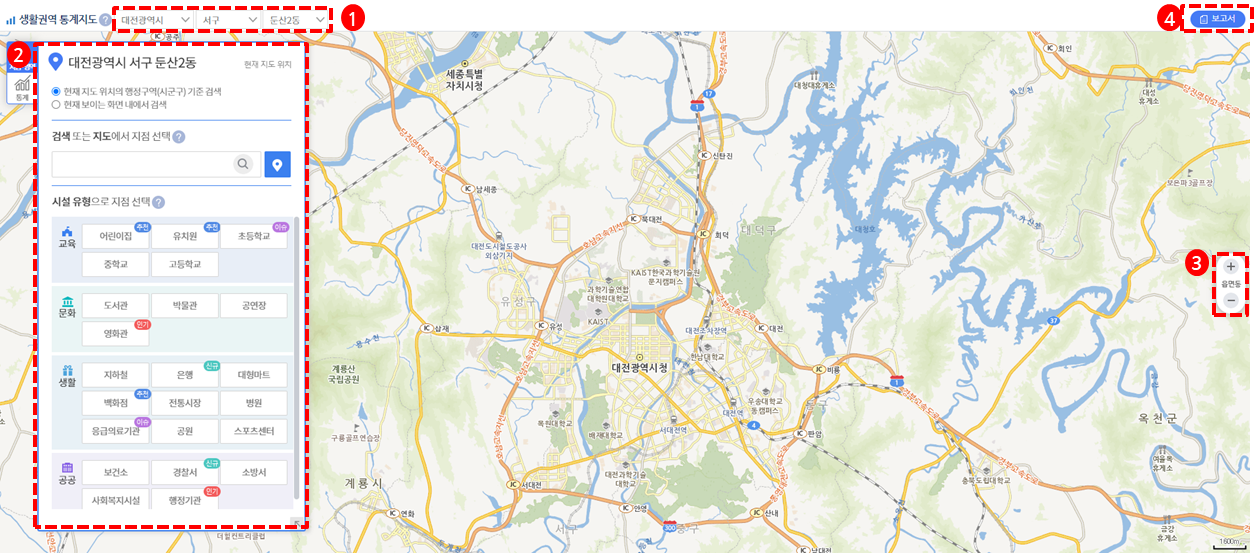
1) Region setting: Users can move to a specific region on the map through region setting
2) Center setting: Users can set the center of the living area
3) Scaling: Users can adjust the scale of the map to zoom in or zoom out.
4) Report output: Users can print out data in the form of report.
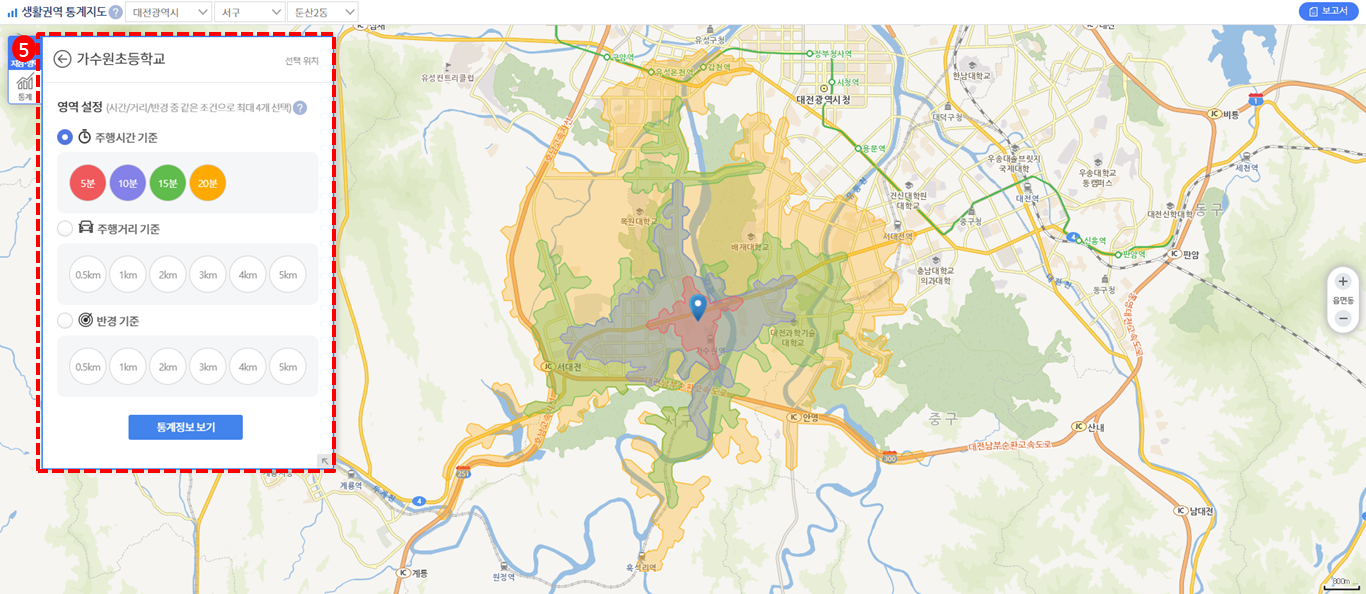
5) Area setting: Set an area based on the driving time, mileage and radius by using the road network data that include information such as road length and the average required time.
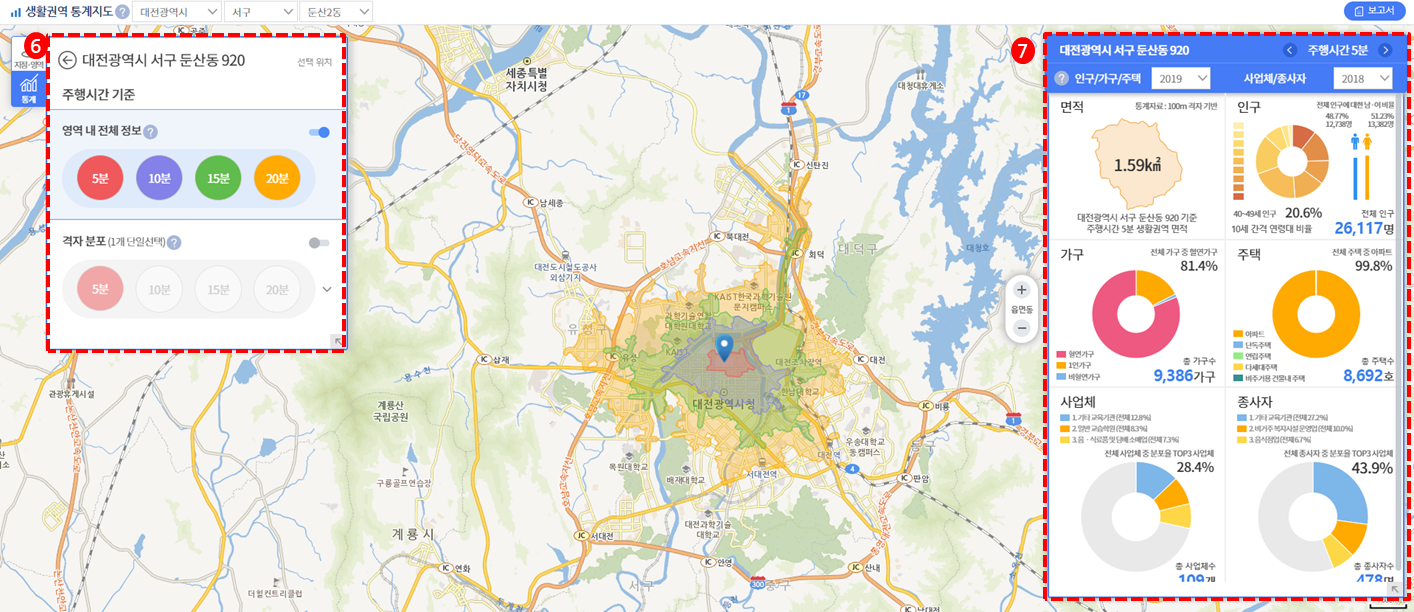
6) Statistical information: Users can change the map display type of the selected area and retrieve statistical information after specifying conditions.
7) Data board: Depending on the searched statistical information, users can check data in various forms, such as bar graphs and pie graphs.
Job Map

Service Overview
○ 'Job Map' is a service that provides job information and status that meet the user's conditions, such as today's job status, job view, and job status analysis using job information collected from Worknet, Saramin and Incruit.
○ In addition, the job statistics analysis is a service that allows you to search indicators such as job status, job increase or decrease, job quality, economic situation and the quality of life.
○ Main function
- Today's Job Status
: Today's Job Status is a service that allows you to search the current status and daily increase or decrease of all, new and terminated jobs registered in Worknet, Saramin and Incruit.
- Job View
: Job View is a service that allows you to search job information under various conditions.
- Job Status Analysis
: Job Status Analysis is a service that allows you to search by region and target for the job status you want to know by supporting various job topics using job information of Worknet, Incruit and Saramin.
- Job Statistics Analysis
: Job Statistics Analysis is a service that allows you to inquire about job status/increase or decrease/quality, economic status and the quality of life
Screen Layout
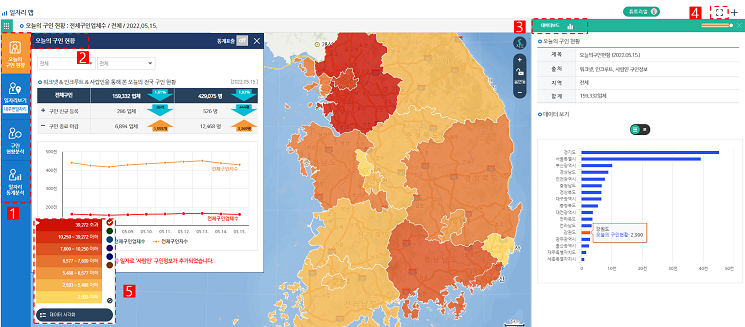
1) Menu selection: Runs today's job status, job view, job status analysis and job statistics analysis.
2) Today's Job Status: You can select the region of your interesting for Today's Job Status.
3) Data board: Provides inquired statistical data information in the form of graphs, etc.
4) Map Zoom In/Out: Zoom in and out of the map.
5) Legend window: Displays the legend of the displayed statistics and the legend settings can be changed.
Policy Statistical Map
Service Overview
○ 'Policy Statistics Map' is a service to show the past and current statistical changes about major statistical indicators such as population, household, house, business, and to help policy decision of the community through this.
○ Features
- Region and Indicator Selection: Select a province or Si, Gun, & Gu area to retrieve statistics, and select statistical indicators.
- Statistics Change: Displays past and current statistical information for selected indicators in the form of map, graph, and table.
- Convergence: By displaying the converged map of the selected indicator and the changed statistical information, you can see the statistical change by region at a glance.
○ Key statistical indicators
- Changes in population (15 types): Changes in male / female population, population density, aging index, infant population, elderly population, etc.
- Changes in household and housing (13 types): Changes in total houses, single-person households, single-person households over 65 years old, farm households, apartments,
- Changes in Businesses (10 types): Changes in total businesses, wholesale and retail, manufacturing, agriculture and forestry, PC rooms, Chicken restaurants, coffee shops
Screen Layout
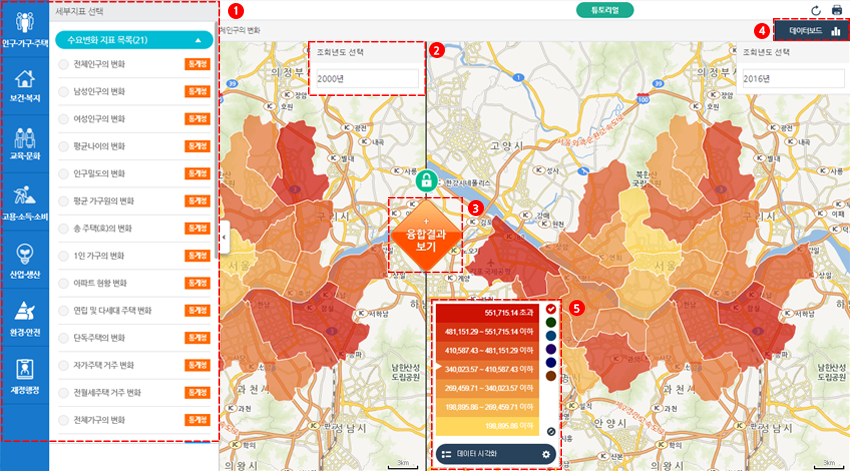
1) Set up statistics items: Set up statistics items and detailed conditions.
2) Year setting: Set year to view.
3) Convergence: In the new window, you will see the merged data information of both maps.
4) Data board: Provides statistical data in the form of graphs.
5) Legend Window: It displays the legend of the displayed statistical value and can change the legend setting.
The Neighborhood Where I Want to Live
Service Overview
○ 'The Neighborhood Where I Want to Live' is a statistics-based service that recommend residential areas, which meet users' conditions.
○ Users can check a list of recommended regions and statistical information that meet their conditions among a total of 51 kinds of indicators of 7 categories such as nature, housing, population, safety, social infrastructure (including transportation), education, and welfare & culture
○ Major functions
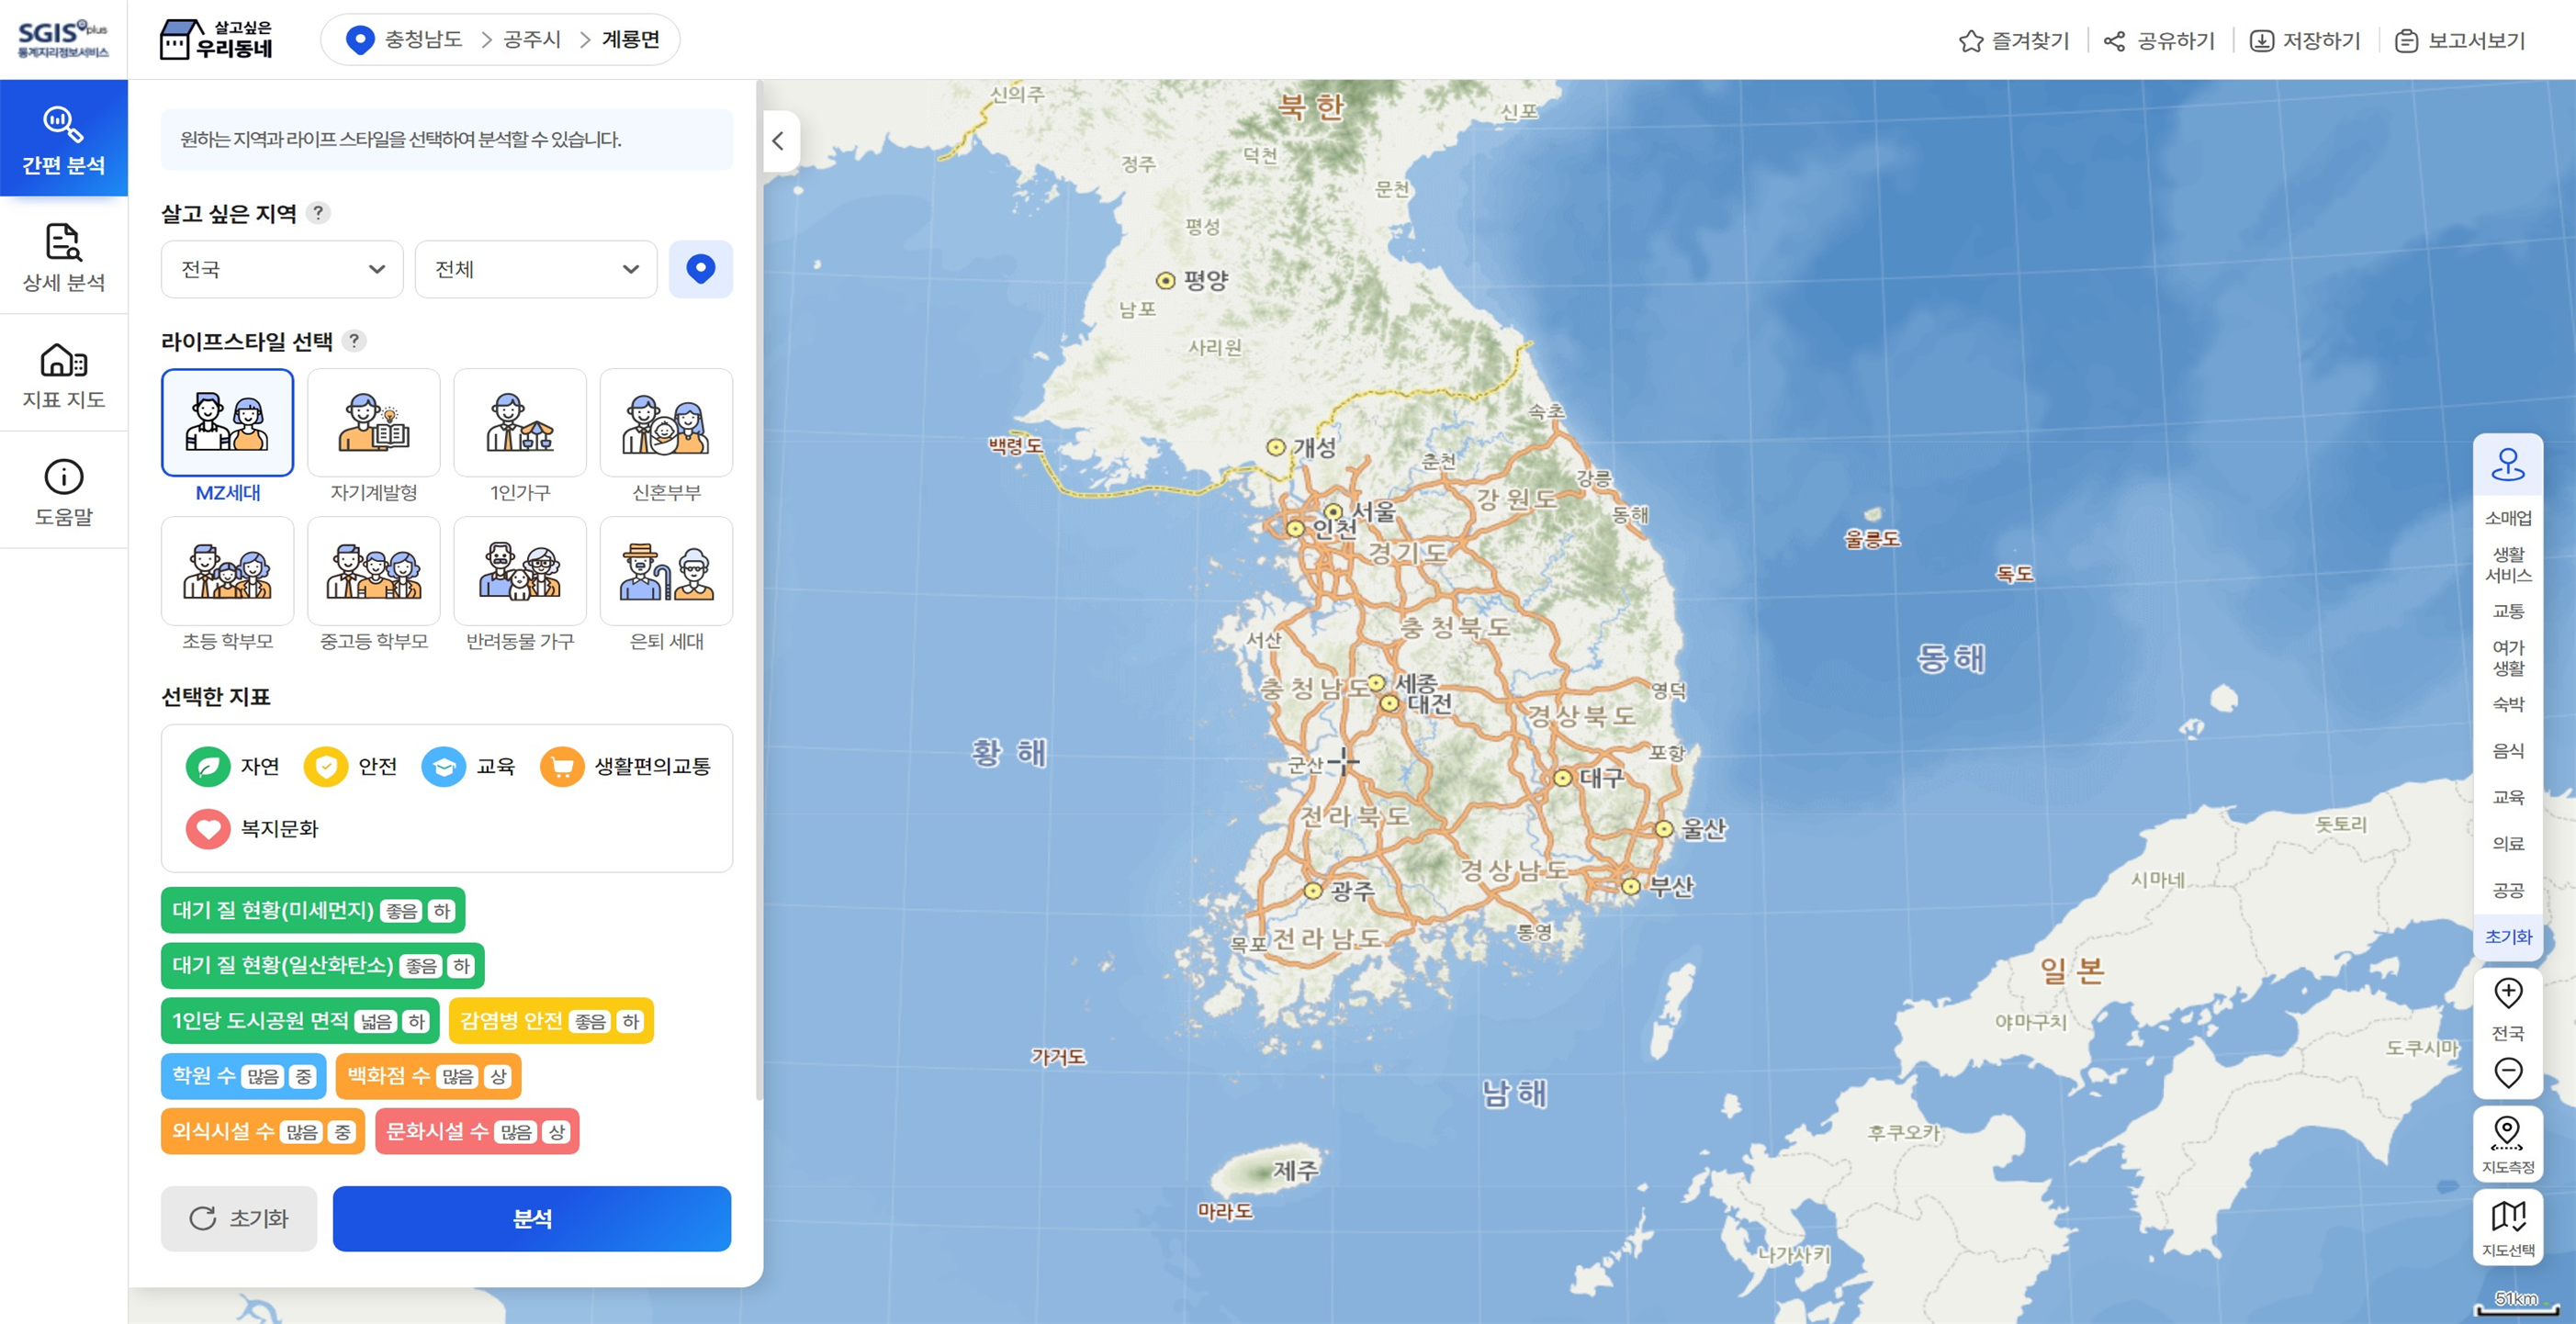
- Brief analysis
: A service that recommends a residential area after analyzing indicators according to users' lifestyle. This service has detailed functions such as recommending a region where users want to live, finding indicators automatically according to their lifestyle and viewing a list of recommended regions.
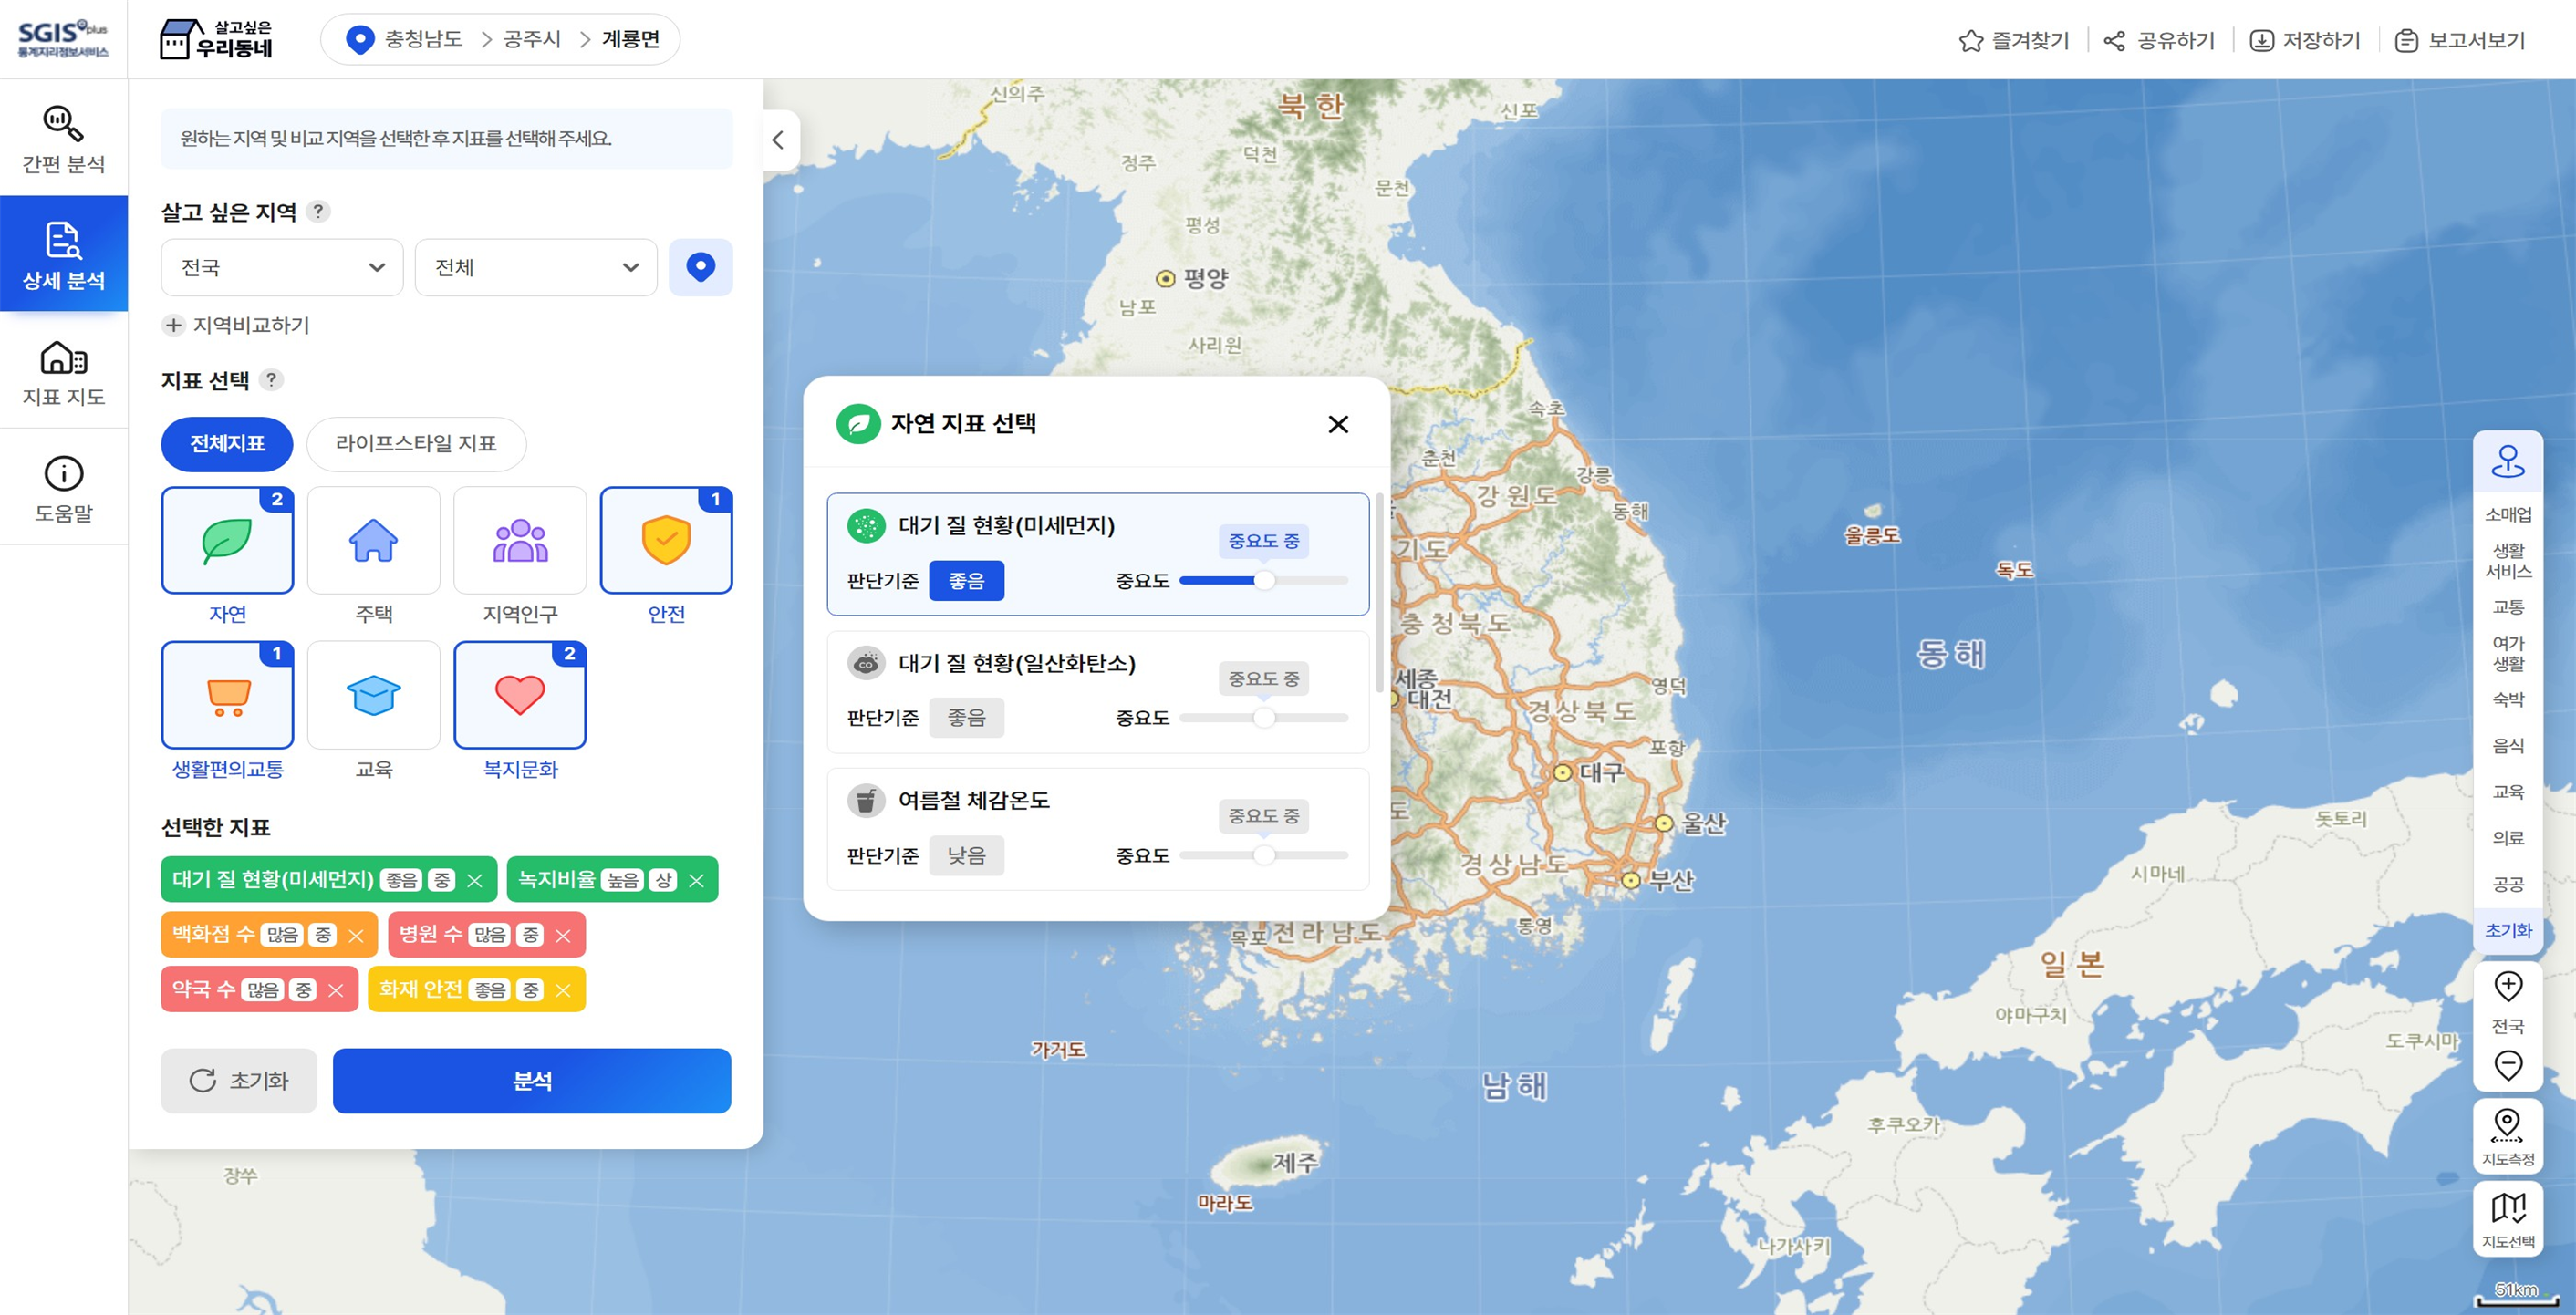
- Detailed analysis
: A service that recommends a residential area after analyzing selected indicators. This service has detailed functions such as recommending a region where users want to live, providing indicators according to their lifestyle, setting judgement standard and importance, and viewing a list of recommended regions.
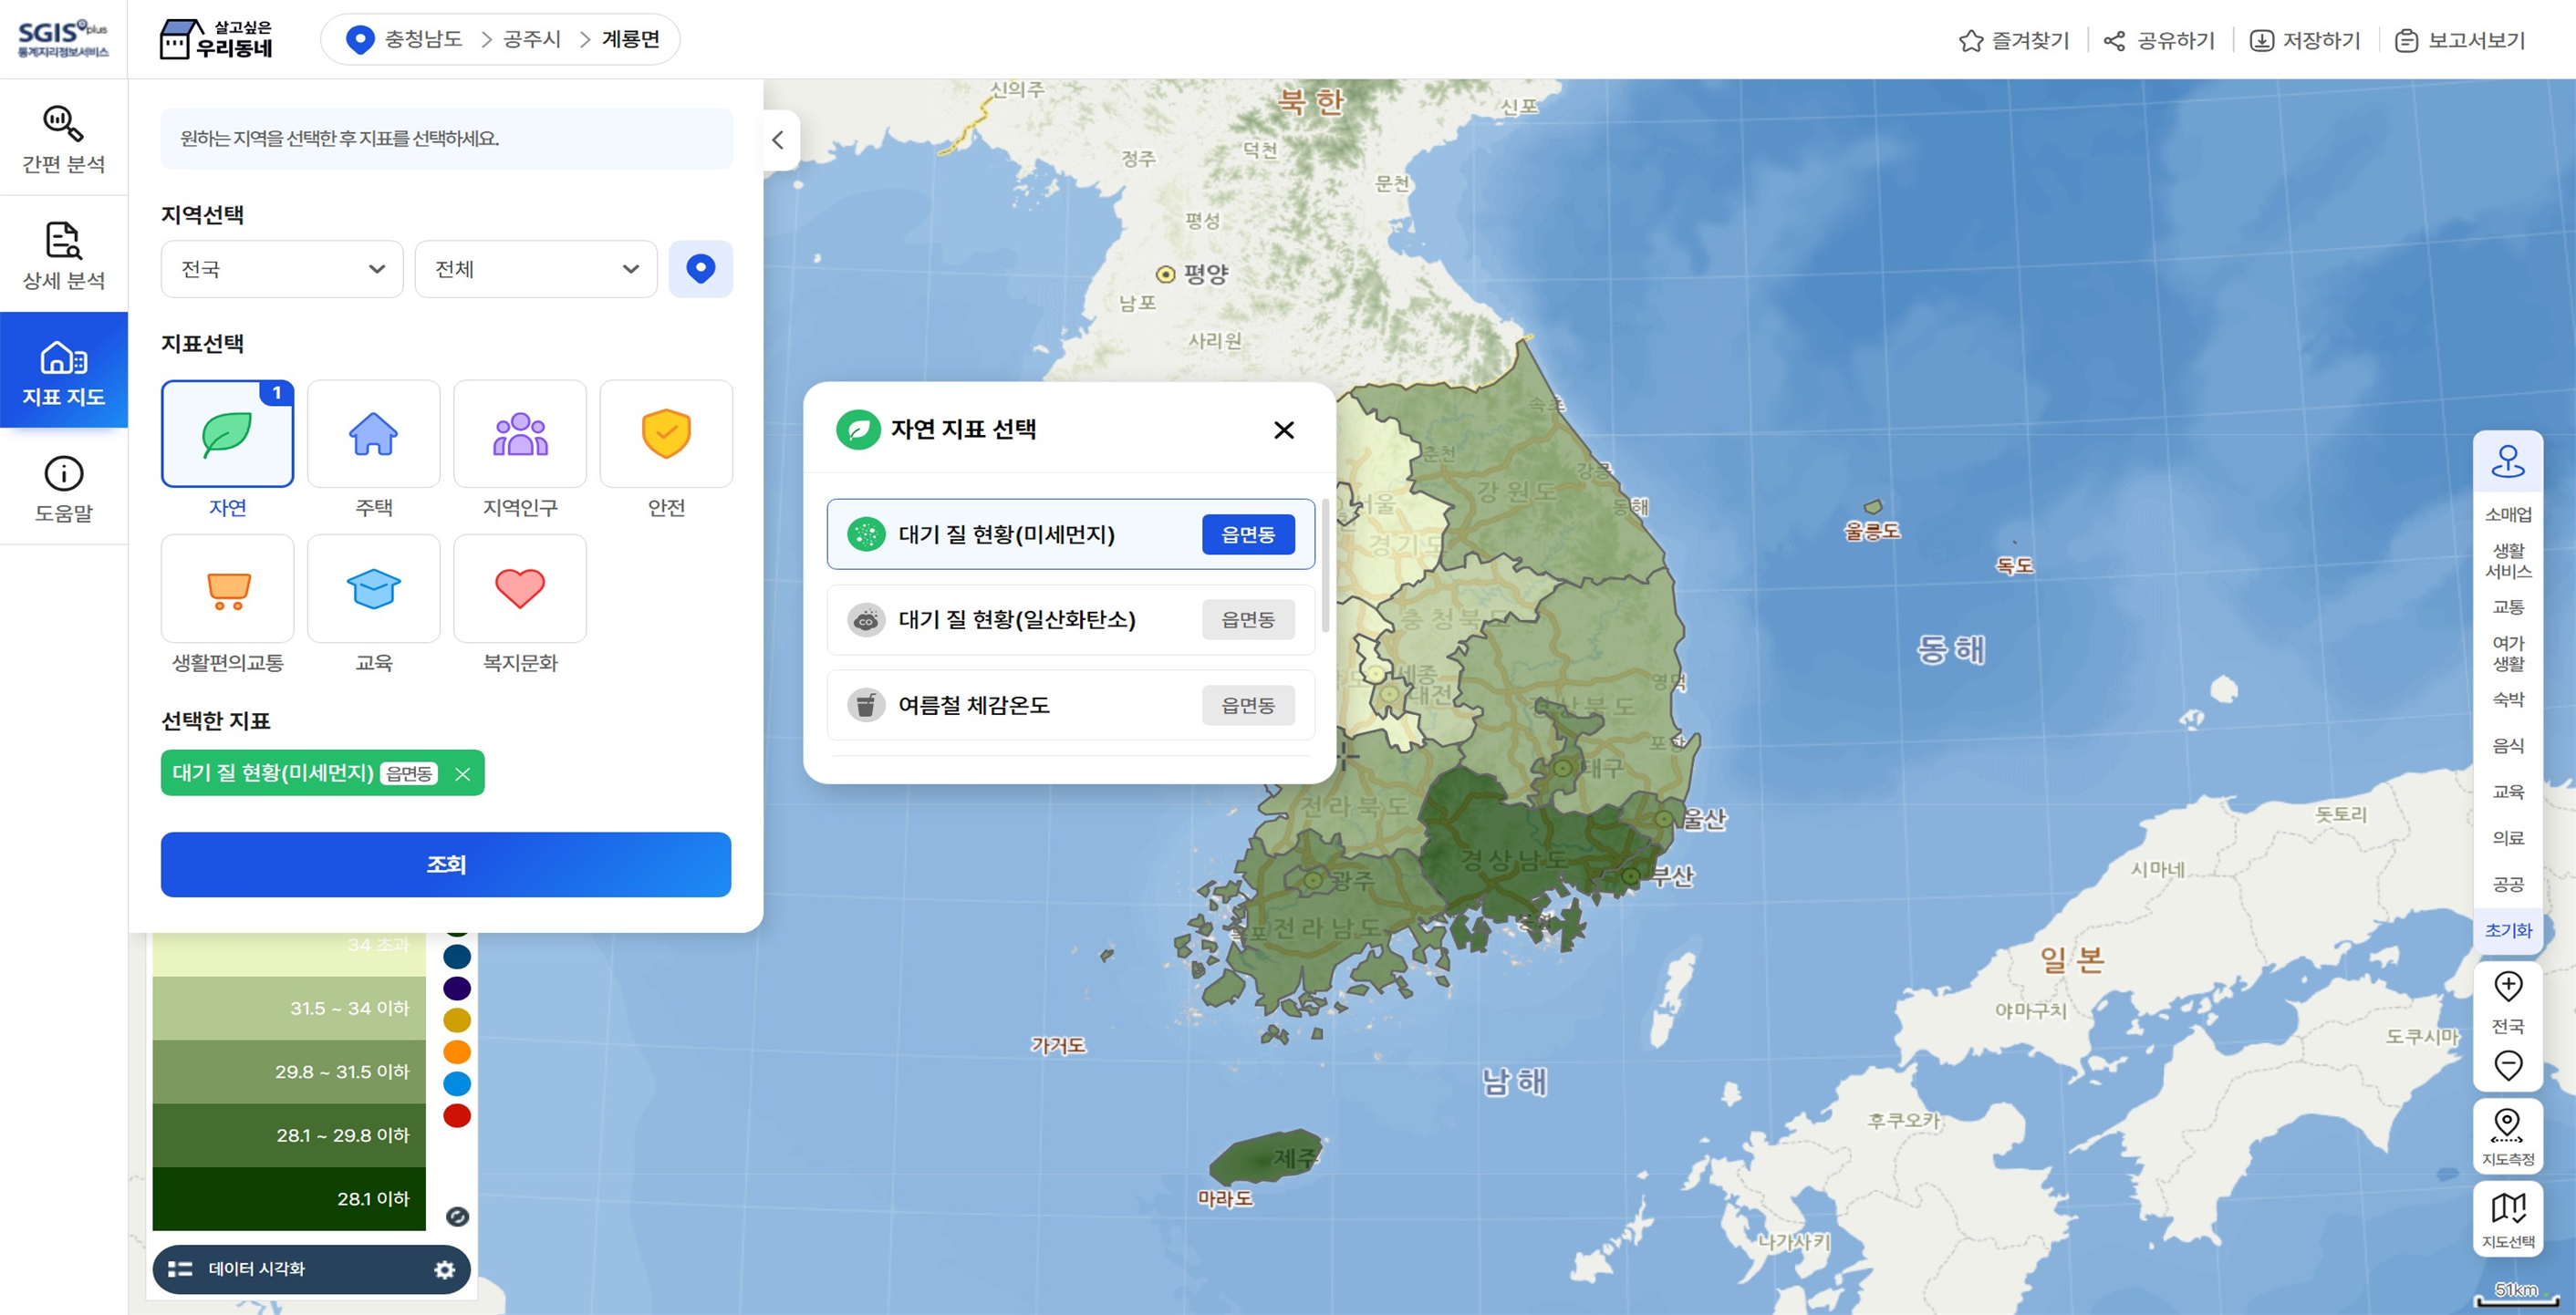
- Indicator map
: Users can check the status by region of the selected indicator and information on the population, housing and establishments.
○ Major indicators
- Nature: air quality status (fine dust), air quality status (Carbon monoxide (CO)), perceived temperature in summer, perceived temperature in winter, percentage of green space, urban park area per person, etc.
- Housing: share of apartments, share of row houses and apartment units in a private house, share of detached houses, residential area, share of old housing units, share of owner-occupied housing units, officially assessed land price, etc.
- Local population: share of the young population, share of the youth and middle-aged population, share of the elderly population, share of one-person households, share of workers of establishments, net migration rate, etc.
- Safety: fire safety, traffic accident safety, crime safety, life safety, infectious disease safety, CCTV distribution status, etc.
- Living convenience transportation: number of convenience stores, number of department stores, number of large discount stores, number of supermarkets and convenience stores, number of grocery stores, number of restaurants, number of public transportation facilities, number of pet-related service establishments, etc
- Education: number of elementary school students per class, number of middle school students per class, number of high school students per class, Number of elementary schools, number of middle schools, number of high schools, number of private academic institutes, etc.
- Welfare culture: number of kindergartens and childcare facilities, number of hospitals, number of clinics, number of pharmacies, number of veterinary hospitals, number of welfare facilities for the elderly, number of social welfare facilities, number of welfare facilities for the disabled, number of cultural facilities, number of sports facilities, etc.
Screen Layout
Regional Issue Communication Map
Service Overview
○ 'Regional Issue Communication Map' is a service that allows community members to actively participate, identify local community issues, and create a space for communication. It comes with mapping functions by default.
○ Creators of the Communication Map can use interactive statistical maps or 'My Data' functionality to apply relevant statistics to the Communication Map based on the topic.
○ Main Features
- Communication map creation: Communication map information registration, area setting, period setting, and icon setting, etc.
- Create background map: You can display statistical color map of total population, total business, or favorites, and you can also display POI information such as theme or 'My Data', etc.
- Registering comments on the communication map: You can register comments, location, and photos.
- Viewing communication map status: Provides various status information such as opinions on communication map and participant status through charts and tables.
Screen Layout
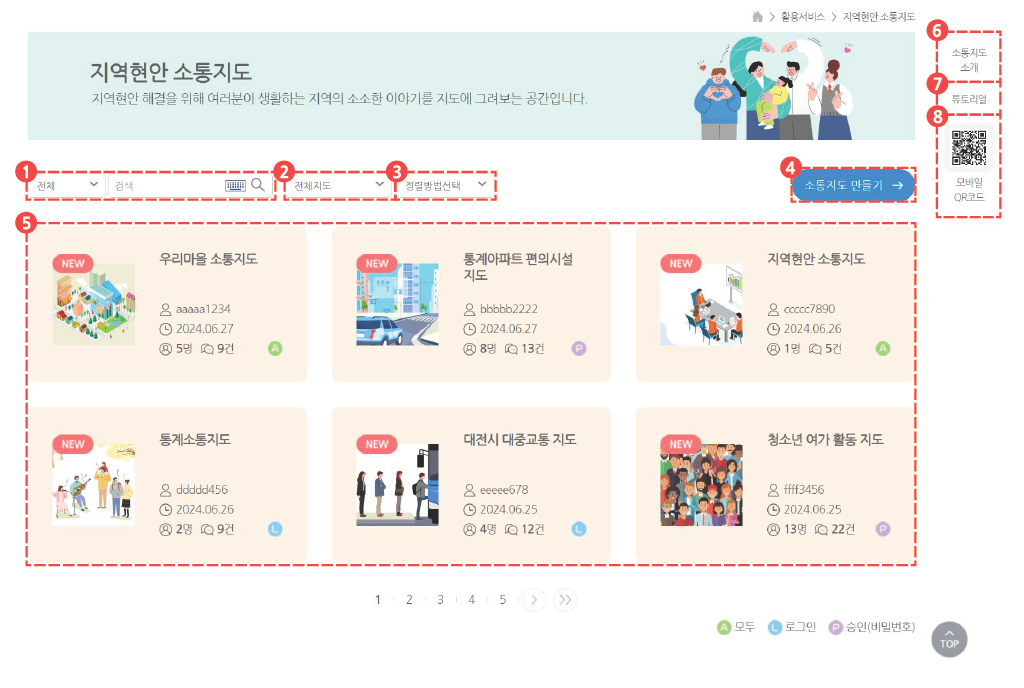
1) Searching for communication map: You can search by total, region name, map name, map introduction, creator ID or tag.
2) Viewing map: You can re-query the entire map and the communication map in progress. If you are logged in, you can additionally re-query the maps you have created.
3) Sorting method: You can re-query the list of statistics communication maps using communication map name, number of participants, number of data entries, registration date, or modification date.
4) Creating a communication map: After the establisher selects the statistical data in accordance with the purpose of operation as a background map, the communication map is created and operated.
5) Communication Map List: The list of communication maps displays the entire list, created, and joined communication maps. When you select a communication map on which you've submitted feedback, you can use functions such as viewing its detailed information, adding comments, and reporting.
6) Introduction to the Regional Issue Communication Map: You can access information such as an introduction to the Regional Issue Communication Map and usage guidelines.
7) Tutorial: A tutorial on how to use the Regional Issue Communication Map.
8) Mobile QR Code: You can access the mobile page by scanning the QR code with your mobile device.
Statistics Map Experience
Service Overview
○ 'Statistics Map Experience' is a service that users can express statistical values visually and spatially on the administrative boundary of the map as needed.
○ You can create color map by administrative area by inputting statistical data or using data such as Excel.
○ Main Features
- Administrative Area Unit Statistics Experience: You can experience statistical experience in the province / city / municipal / eup, myeon-dong.
- Map screen setting: Color setting, label setting, font setting, and legend settings are possible.
- Enter statistical values directly: Users can input statistical values for each administrative area.
- Enter statistics value using Excel: Statistical values can be set using Excel with statistical values of administrative districts.
- Report output: Graphs and charts are displayed, and the generated statistical map is output as a report.
Screen Layout
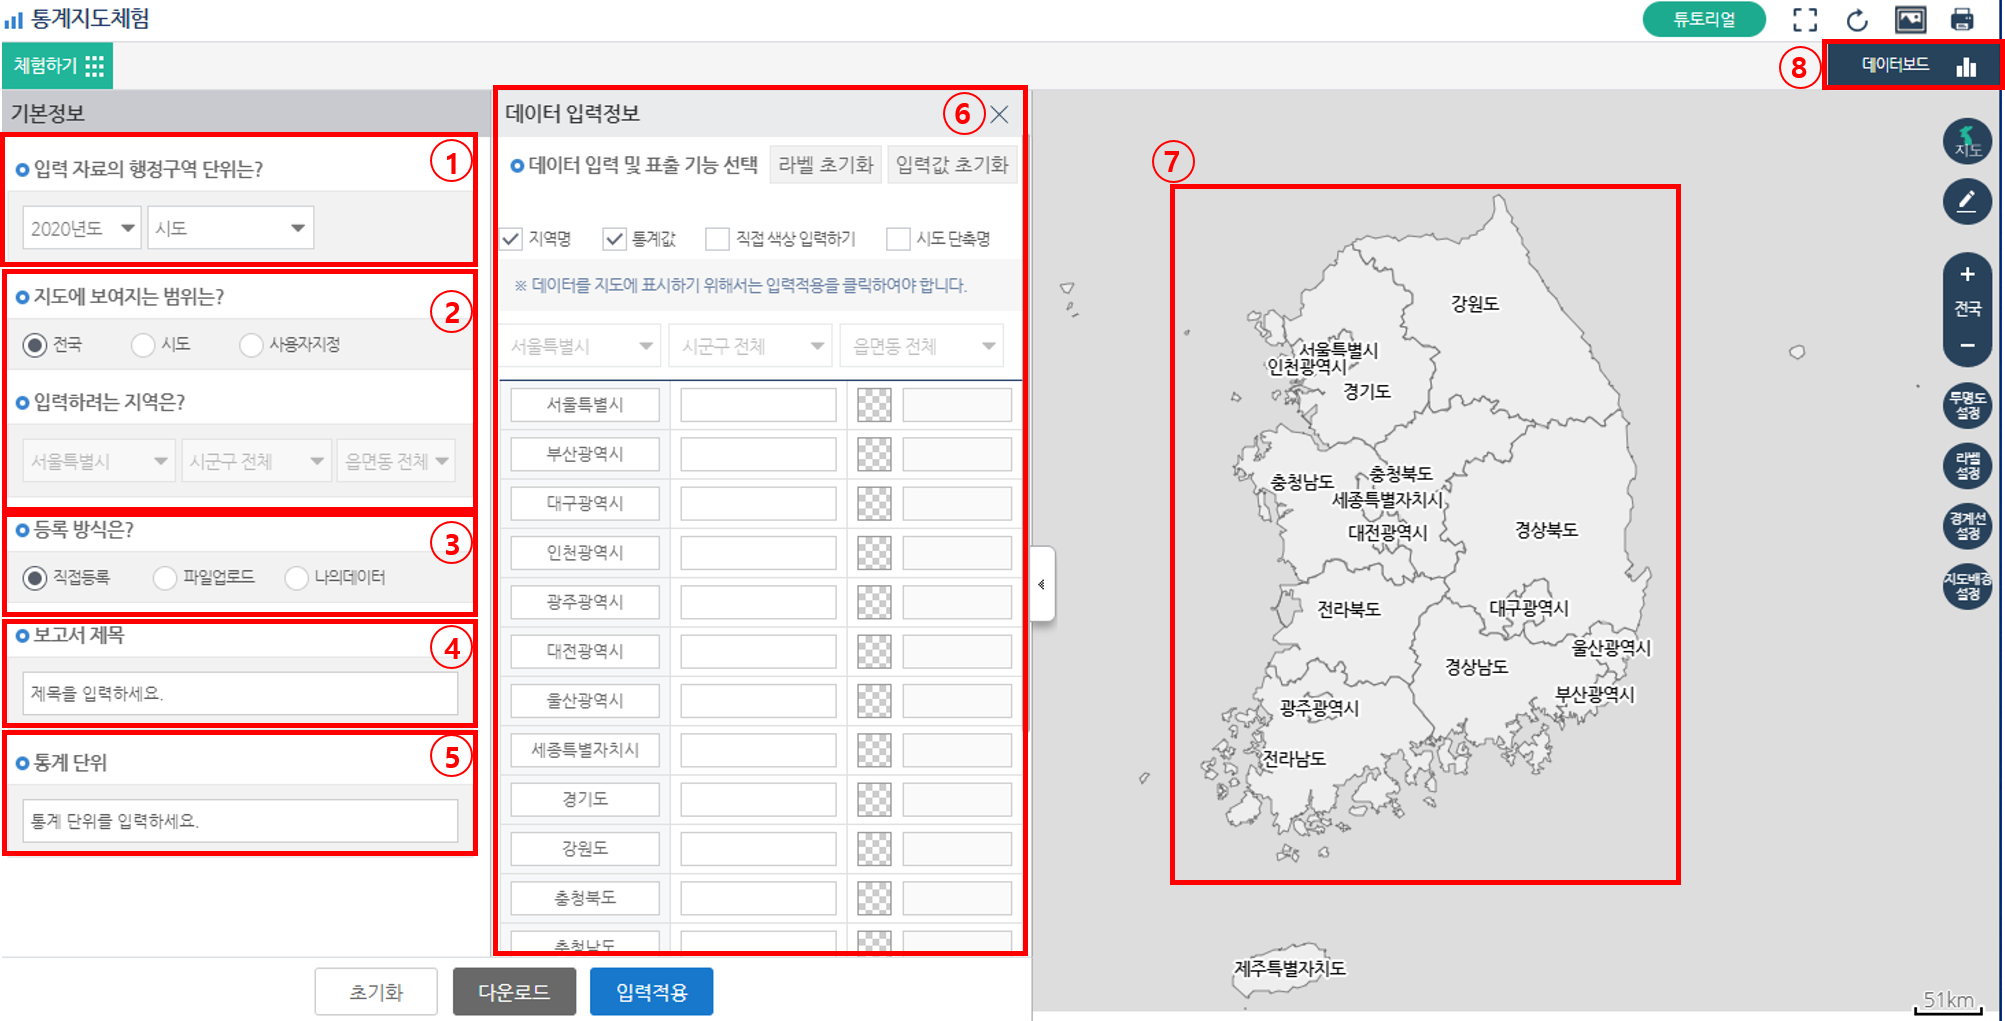
1) Geographical Unit Selection: Choose the geographical unit you want to use, such as province, Si, Gun, & Gu, and Eup, Myeon, & Dong (Initial Setting: Province).
2) Input method selection and data viewing method: You can select input method of value and viewing method of input value.
3) Registration Method Selection: You can set the registration method for the values and data you want to experience.
4) Enter Report Title: When generating a report, you can input and assign a title to the report.
5) Statistical Unit: You can input and assign the statistical unit for the values and data you want to experience.
6) Inputting and applying statistical values: You can input statistical values according to region and apply input values to the local units you want to experience.
7) Map window: It is the map window where the statistical value is expressed in the selected area unit.
8) View data: You can see data of statistical value by region.
Statistics Gallery
Service Overview
○ 'Statistics Gallery' is a service that allows users to share various statistical information retrieved using SGIS or statistical information generated by users and communicate with each other.
○ Main Features
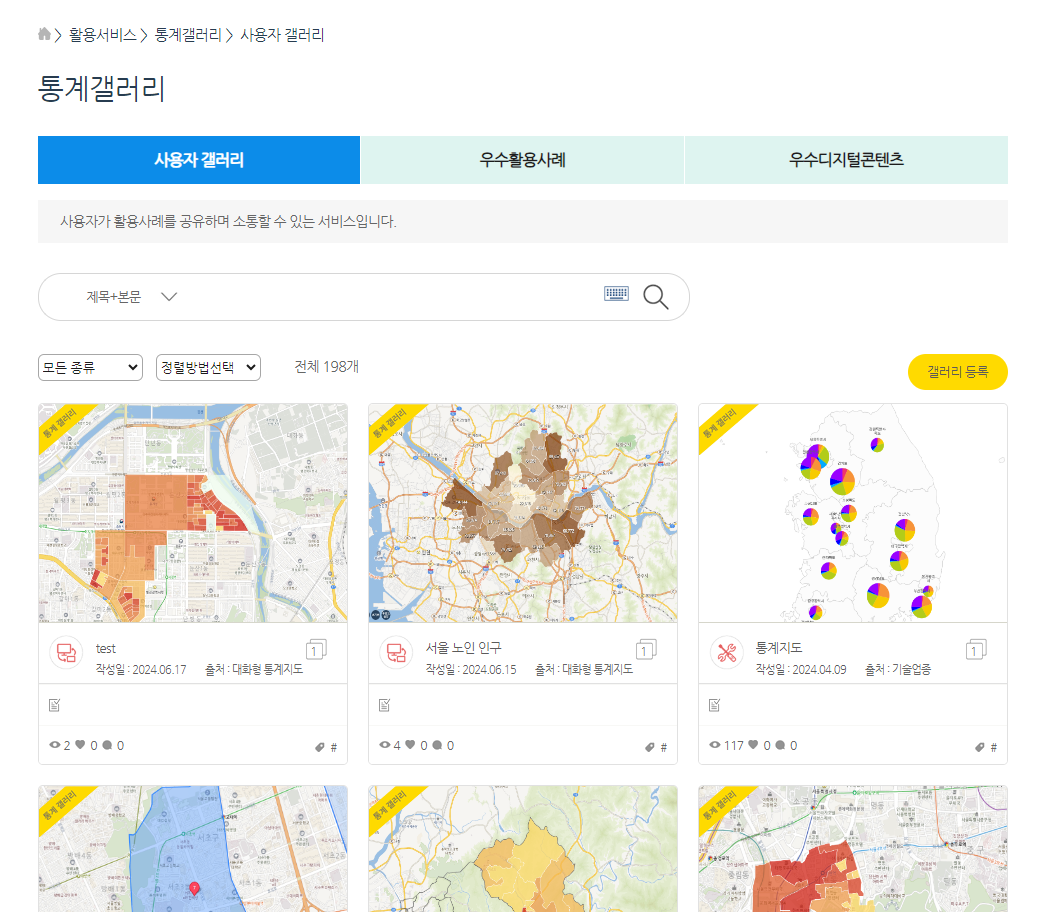
- User gallery: Users can check their statistical gallery or best practices after registering them.
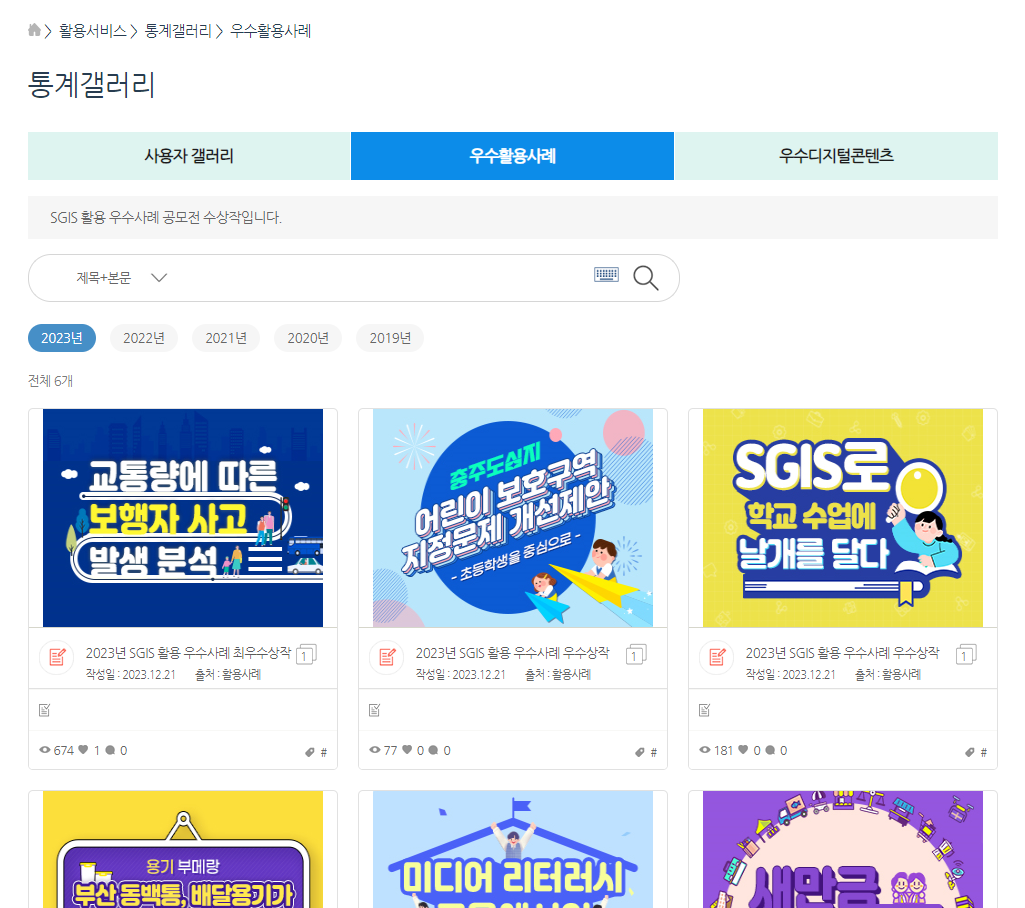
- Best practices: Users can check prize-winning images of the SGIS utilization practice contest.
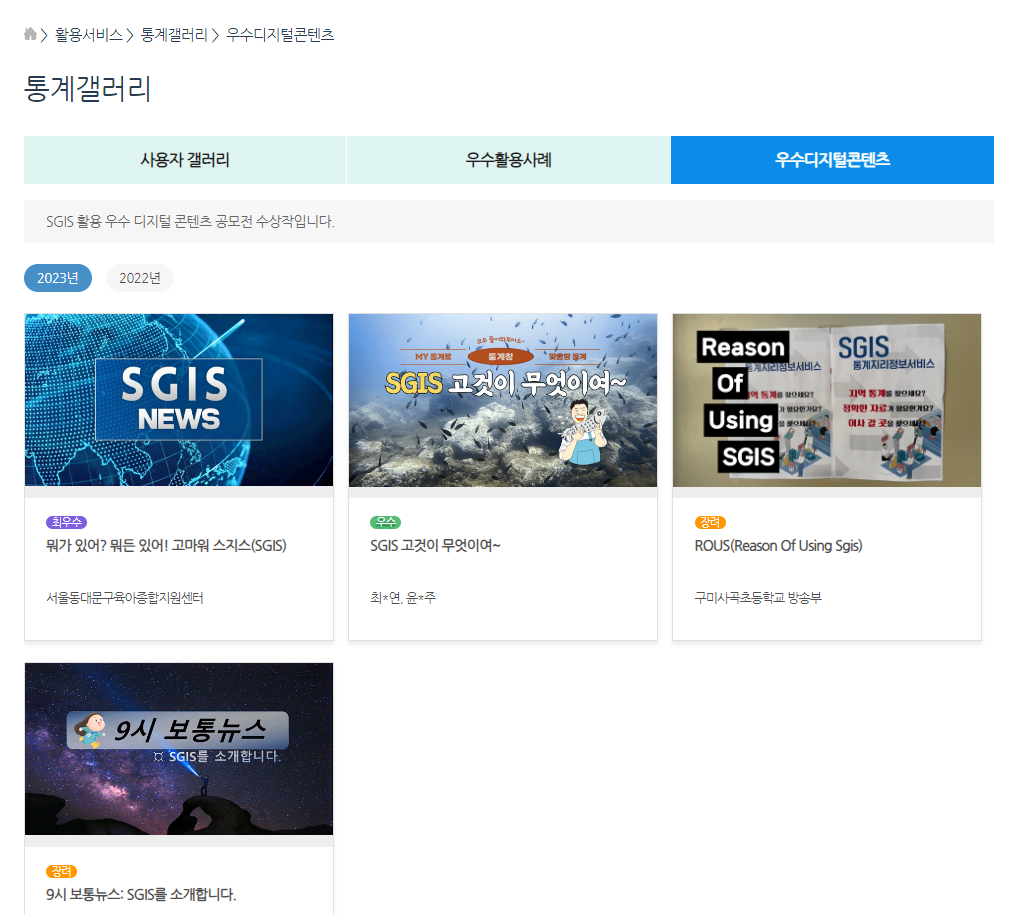
- Best digital contents: Users can check prize-winning contents of the SGIS utilization digital content contest.
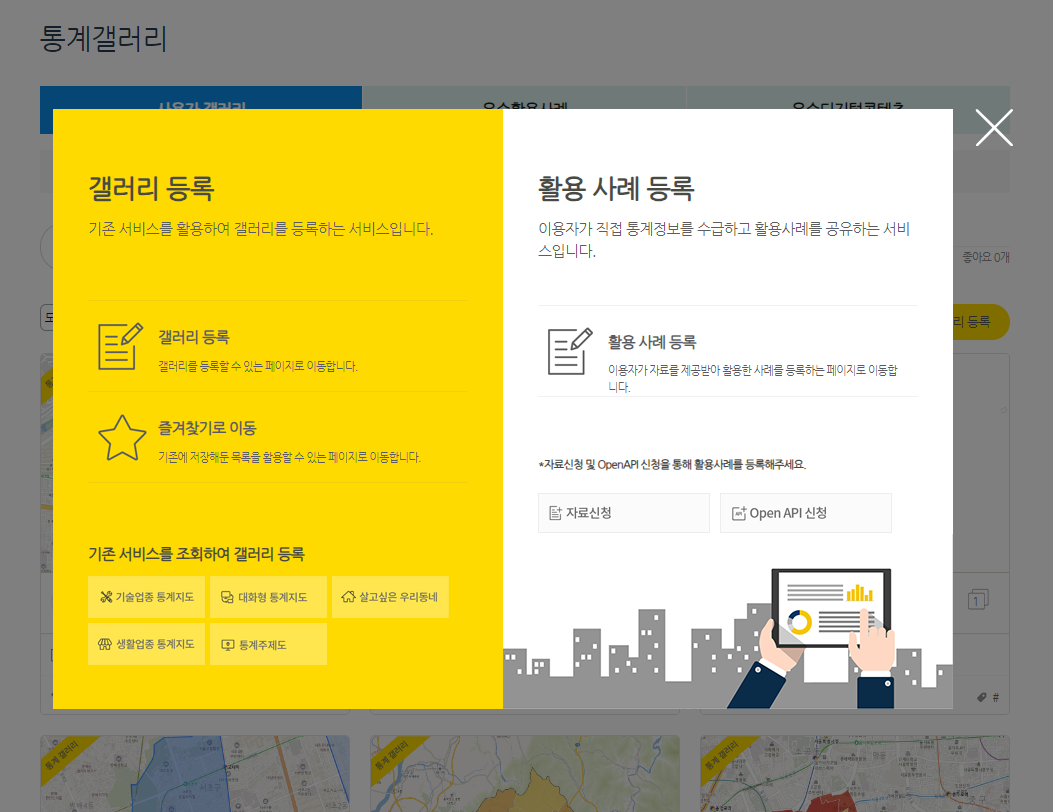
- Gallery registration: You can register the gallery by setting registration information, registering images, selecting existing favorite items, and so on.
- Display existing services and register for gallery: We will display the results of inquiries about major services such as interactive statistical map and the neighborhood where I want to live as a gallery.
- Use case registration: Users register and share cases of receiving and using statistics information directly.
User gallery list screen
Best practices list screen
Best digital contents list screen
Statistical gallery registration screen
○ After logging in, users can utilize their favorite map images of the SGIS contents that they saved or upload their own map images for registration.
My Gallery list screen
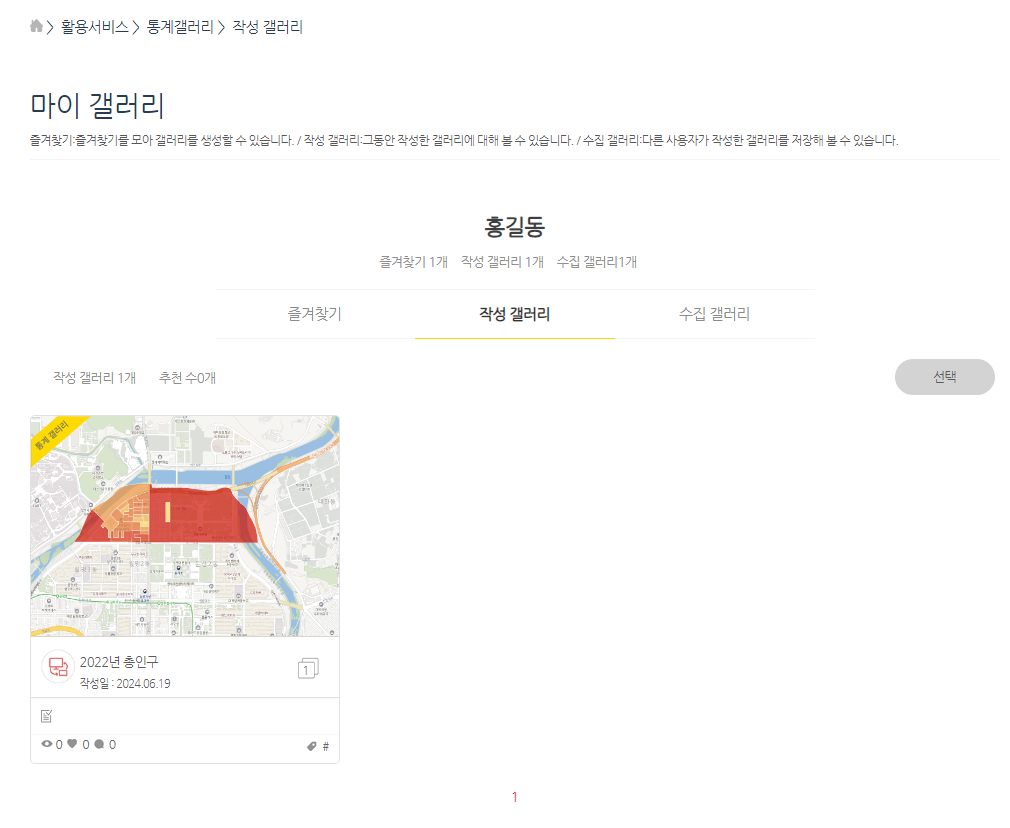
○ 'My Gallery’ is a service where users can view their favorites, created galleries and collected galleries.